Leverage revealed
The true extent of leverage is often unrecognised. A new way of quantifying it is required, says Sean Tully
While there is a growing consensus that leverage played an important role in current and past financial crises and needs to be more strictly limited, there is no common view of how to measure, monitor and limit leverage, especially for securitisation and derivatives.
In the 1920s, investors bought stock on margin, leveraging up. In the 2000s, investors bought houses with no money down. Trusts in the 1920s issued common equity, preferred shares and debt, and used that capital to purchase common equities: levered vehicles buying levered investments. Further investment trusts were set up to buy the equity of other investment trusts, layering leverage again, driving an insatiable demand for stocks which later collapsed. In the 2000s, lev- ered banks set up special purpose vehicles which issued mortgage backed securities (MBS), to buy highly-levered mortgages. Then banks set up CDOs to buy mezza- nine MBS, issuing equity, mezzanine and senior debt, layering leverage again, driving an insatiable demand for houses. At their peak, investment trusts achieved a height of 7.7 per cent of US GDP in 1929; in 2009, CDOs reached 12 per cent.
The crisis of 2007-2009 was a repeat of the excessive leverage of the 1920s: lever- age layered on leverage which went unmeasured. There is an urgent need to understand better what leverage is and how to limit it. Balance sheet leverage misses the mark, as it does not capture the embedded leverage in the assets on the balance sheet. Given the potential for pyramiding there may be several layers of leverage in modern investment structures. Via securitisation and derivatives the risk and return of the 1920s investment trusts can easily be replicated. None of the cur- rent measures of risk, neither Value at Risk (VAR), stressed VAR, incremental risk charges (IRC), rating agency ratings, nor balance sheet leverage, capture this risk. It remains hidden.
The embedded leverage of a mezza- nine slice of MBS can be extraordinarily high. Assume a slice of mezzanine debt has 3 per cent subordination and is 3 per cent wide. This means this 3 per cent investment supports all of the debt above it, i.e. 97 per cent. This is economically equivalent to buying all debt above the 3 per cent subordination by putting up just 3 per cent cash and borrowing the other 97 per cent on a non-recourse basis. That means the 3-6 per cent mezzanine slice of debt is really 97/3 or 32.3 times levered.
Next a bank may have balance sheet leverage of ten times. If a bank fills its bal- ance sheet with nothing but 3-6 per cent tranches of MBS, that bank is really multi- plying its balance sheet leverage by 32: and 32 times ten gives leverage of 320:1.
What if the mezzanine layers of the MBS are purchased by a CDO and that CDO issues slices of debt? Each of those slices represents another layer of leverage and further multiplies the risk.
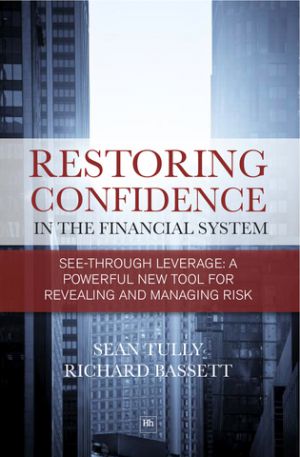
In my book Restoring Confidence in the Financial System, many examples of this are shown, including examples of AAA-rated CDO slices which required less than 1 per cent capital under Basel 2 banking rules, and which were 2,000 times leveraged (a 0.05 per cent loss in the underlying mortgage pool at the point subordination is gone reduces the value of a security from one to zero.) This is what happened during the crisis.
All of the current risk metrics used, VAR, stressed VAR, IRC and ratings agency ratings start by assuming a future probability distribution of losses and then by going out to the tail of the distribution to determine a confidence level of safety. This presumes, in accordance with the options pricing theories of US Nobel lau- reate Robert C. Merton, that we can pre- determine the tails of these distributions: Benoît Mandelbrot and Nassim Taleb, however, tell us this can not be done. Various episodes indicate they are right, including: the pro-cyclical effect of portfolio insurance in the crash of 1987; the LTCM blow-up of 1998; and the recent implosion of the banking system, whose Basel 2 risk assumptions also drew heavily on Merton?s mathematics.
A new measure of risk is needed. See Through Leverage (STL) is defined as the movement of the value of an asset with respect to the most distant assets that it references, at the point the asset begins to lose money. This definition is a general- isation of the common use of the word leverage, and can help to show how sen- sitive we are to an error in our assumptions. STL is orthogonal to all existing measures of risk and
explains a highly statistically significant portion of the ratings transitions which occurred during the crisis. Furthermore, it is a stable measure through the cycle and therefore avoids the pro-cyclicality of current risk measures.
It is imperative that we learn the les- sons of this recent crisis, and that STL is used to measure risk. Otherwise, as is being done now, we will use higher multi- pliers on existing risk measures, forcing banks again to hide the leverage with highly levered investments, such as the rejuvenating CLO market. In short, we will have another crisis ? and no lessons will have been learned.
Sean Tully is managing director, WestLB Debt Markets